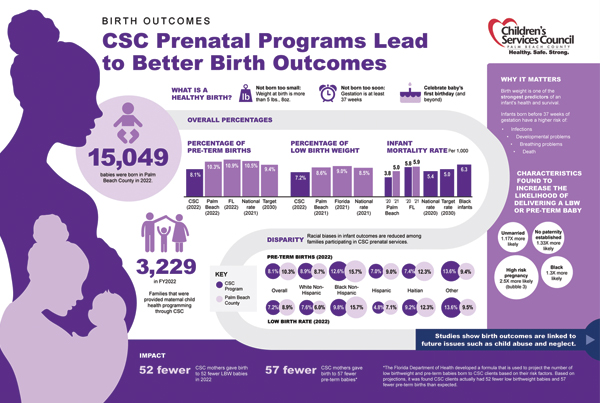
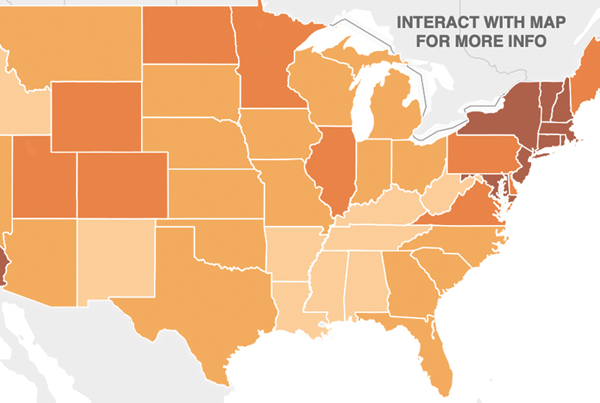
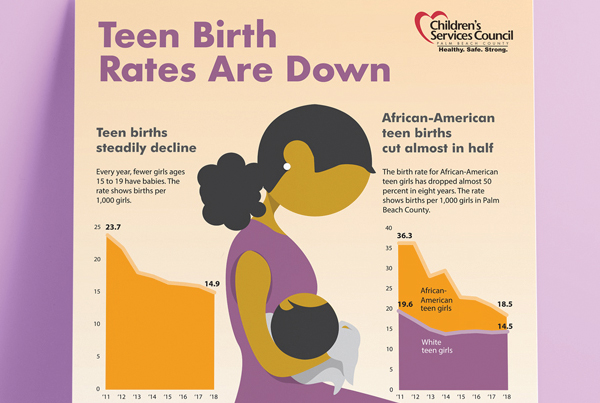
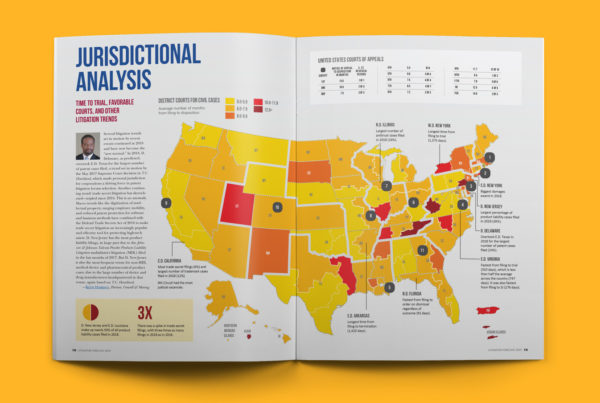
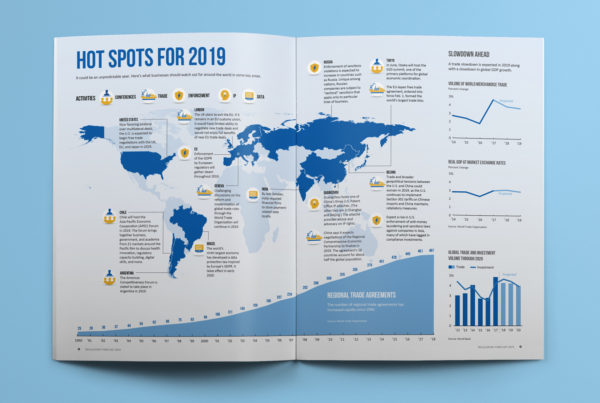
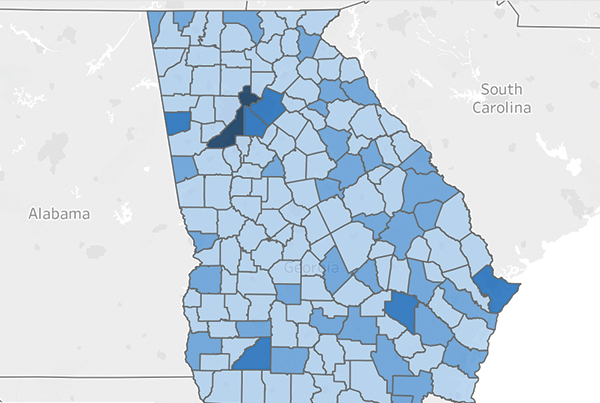
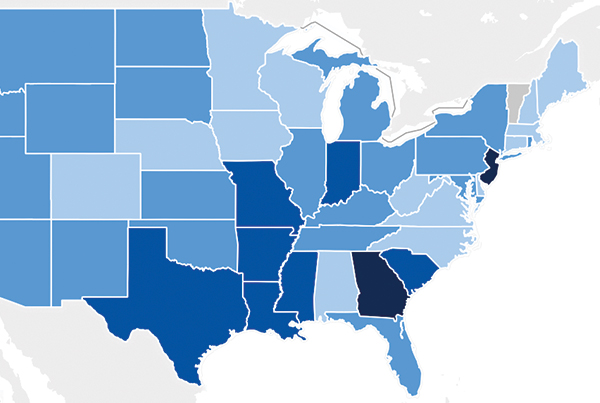
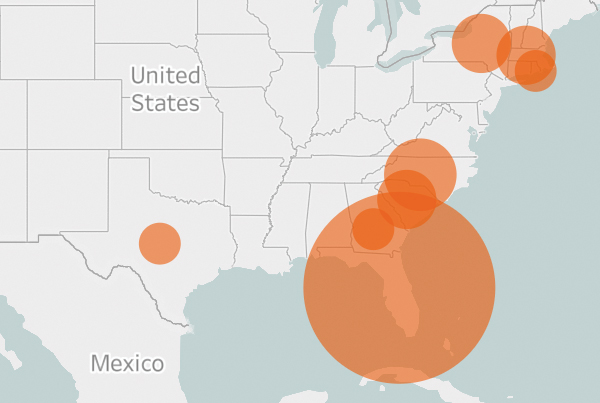
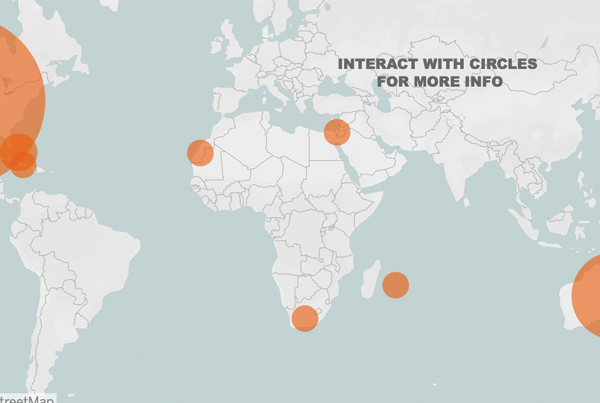
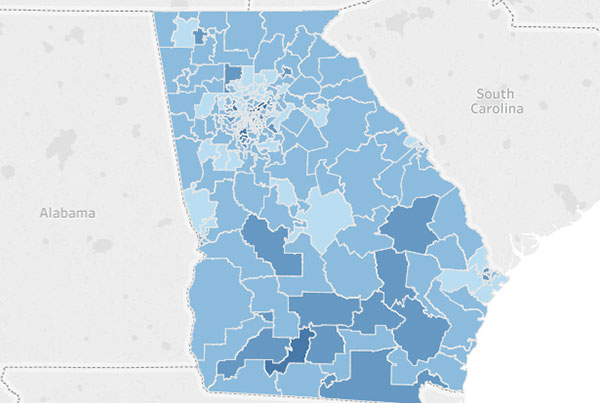
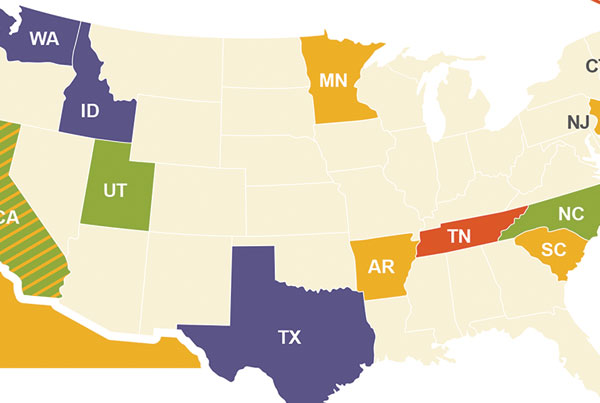
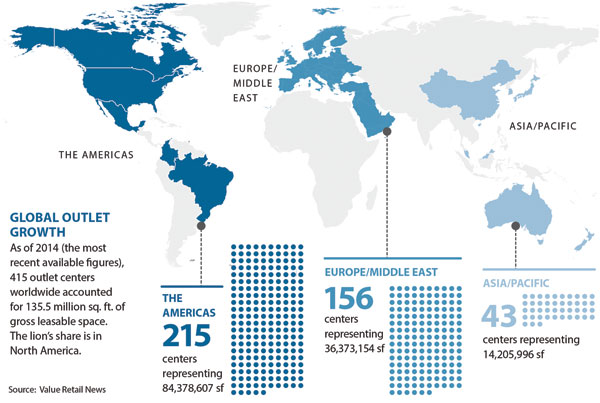
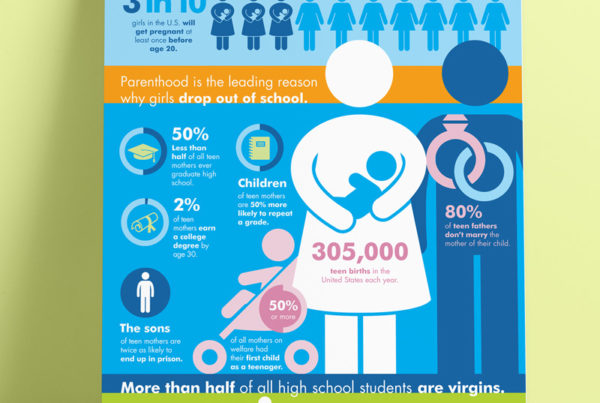
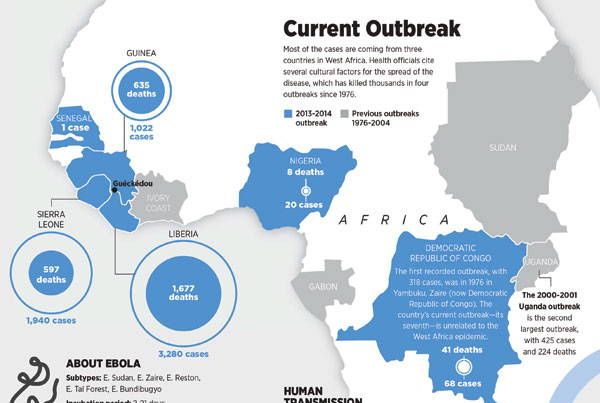
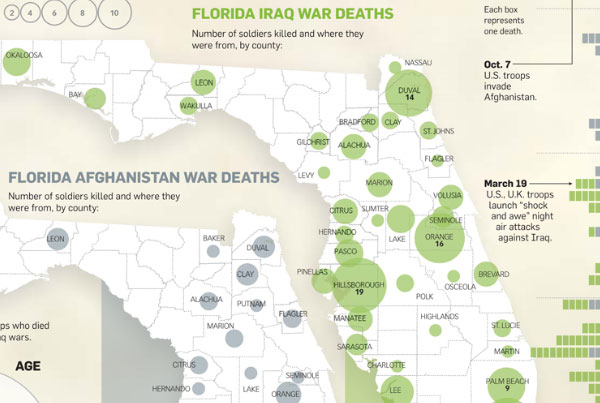
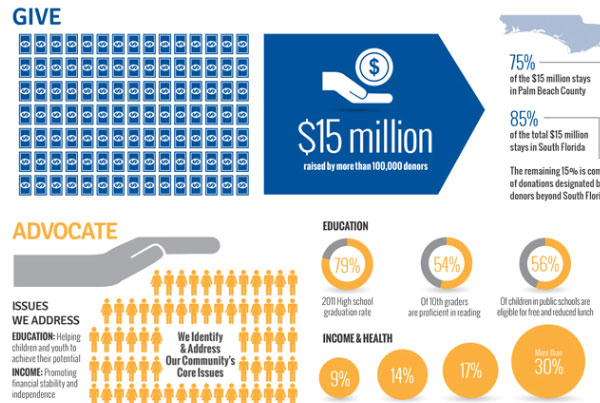
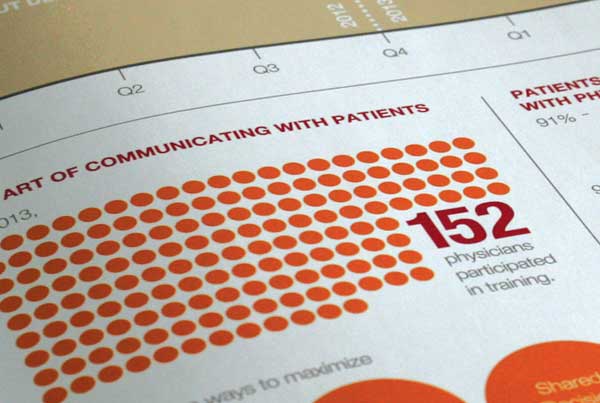
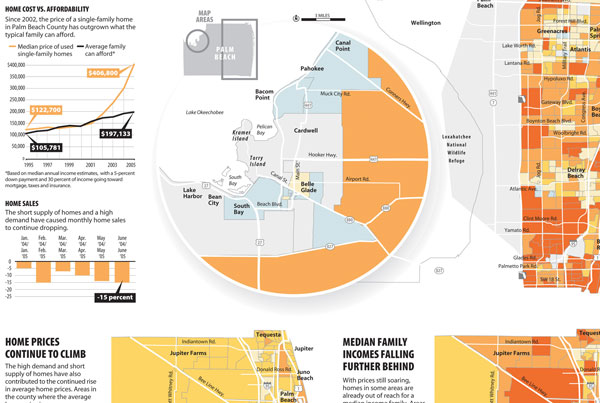
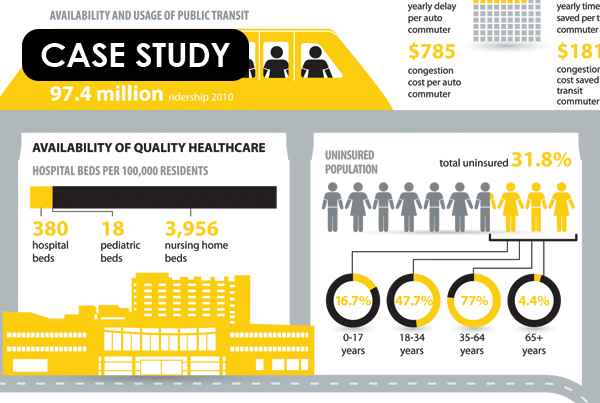
Statistics often lead to data visualizations. Whether that is a data map, pie chart, bar graph or fever line, we take your data and find clear, interesting and engaging ways to tell your visual story. We convert pages of mundane numbers into a visually appealing infographic that’s informative and easy to digest.